---
title: "Within-Host Dynamics of Vaccine-Induced Immunity"
subtitle: "An ODE model of antibody production and waning — Post 1 in the Digital Twins for Vaccine Trials series"
author: "Jong-Hoon Kim"
date: "2026-04-22"
categories: [digital twin, vaccine, immunology, ODE, R]
bibliography: references.bib
csl: https://www.zotero.org/styles/vancouver
format:
html:
toc: true
toc-depth: 3
code-fold: true
code-tools: true
number-sections: true
fig-width: 7
fig-height: 4.5
fig-align: center
knitr:
opts_chunk:
message: false
warning: false
fig.retina: 2
---
```{r setup, include=FALSE}
library(deSolve)
library(ggplot2)
library(dplyr)
library(tidyr)
library(patchwork)
theme_set(theme_bw(base_size = 12))
```
# Why start here?
The [previous post](../digital_twin_clinical_trial/index.qmd) introduced digital twins for clinical trials at a high level. A vaccine digital twin is, at its core, a model that takes one patient's characteristics as input and predicts how their immune system will respond to a given vaccine regimen. Before we can build that model, we need to understand what it needs to represent.
The answer is antibody kinetics: the rise and fall of serum IgG following vaccination. Almost every vaccine endpoint — neutralisation titre, correlate of protection, waning immunity, need for boosters — is downstream of this single quantity. Mechanistic models of antibody kinetics are therefore the foundational building block for everything that follows in this series.
This post derives a minimal but biologically grounded ODE model, implements it in R, and shows what it can (and cannot) capture. Posts 2 onward build directly on this foundation.
---
# The biology in brief
When a vaccine antigen enters the body, a cascade of events unfolds over days to months [@victora2012]:
1. **Innate activation.** Dendritic cells at the injection site capture antigen and migrate to draining lymph nodes, presenting peptide fragments on MHC molecules.
2. **B-cell activation and germinal centre reaction.** Antigen-specific naive B cells recognise the antigen, receive T-cell help, and enter germinal centres — specialised microstructures in the lymph node where rapid proliferation, somatic hypermutation, and affinity maturation occur.
3. **Plasma cell differentiation.** Germinal-centre B cells differentiate into plasma cells — antibody factories. *Short-lived plasma cells* (SLPCs) emerge within days and produce a rapid burst of antibody before dying in 1–2 weeks. *Long-lived plasma cells* (LLPCs) migrate to bone-marrow niches and can survive for decades, secreting antibody constitutively [@slifka1998; @amanna2007].
4. **Memory B-cell formation.** A fraction of germinal-centre B cells exit as memory cells rather than plasma cells. These are quiescent but respond much faster to a second antigen encounter.
5. **Antibody titre dynamics.** Serum IgG rises as plasma cells secrete antibody, peaks 2–4 weeks post-vaccination, then wanes. The rate of waning reflects the ratio of SLPCs to LLPCs: SLPC-dominated responses wane quickly; LLPC-dominated responses produce persistent titres.
A landmark study by Amanna et al. [@amanna2007] measured antibody half-lives for 10 antigens in a 26-year longitudinal cohort. Half-lives ranged from 11 years (tetanus) to 50 years (vaccinia). The extraordinary persistence seen with the best vaccines is attributed almost entirely to LLPCs settled in bone-marrow niches — a finding that changed how we think about what a good vaccine needs to do.
---
# The ODE model
We model five compartments:
| Symbol | Interpretation | Unit |
|---|---|---|
| $A(t)$ | Vaccine antigen depot | a.u. |
| $S(t)$ | Short-lived plasma cells | a.u. |
| $L(t)$ | Long-lived plasma cells | a.u. |
| $M(t)$ | Memory B cells | a.u. |
| $\text{Ab}(t)$ | Serum antibody titre | a.u. |
The equations are:
$$
\frac{dA}{dt} = -\delta_A A \tag{1}
$$
$$
\frac{dS}{dt} = k_S\, A\,(1 + \phi_S M) - \delta_S S \tag{2}
$$
$$
\frac{dL}{dt} = k_L\, A\,(1 + \phi_L M) - \delta_L L \tag{3}
$$
$$
\frac{dM}{dt} = \varepsilon S - \delta_M M \tag{4}
$$
$$
\frac{d\text{Ab}}{dt} = r_S S + r_L L - \delta_{\text{Ab}}\,\text{Ab} \tag{5}
$$
**Equation 1.** The antigen depot decays at rate $\delta_A$. This captures both in-vivo clearance of the antigen and the finite duration over which the immune system receives stimulation.
**Equations 2–3.** Both plasma-cell populations are stimulated proportionally to antigen availability $A$. The memory-recall term $(1 + \phi M)$ is the crucial feature: on re-exposure, pre-existing memory B cells dramatically amplify plasma-cell production, with $\phi_L > \phi_S$ reflecting the observation that memory preferentially replenishes the long-lived pool during recall responses [@victora2012].
**Equation 4.** Memory cells accumulate proportional to SLPC production (fraction $\varepsilon$) and decay very slowly ($\delta_M \ll \delta_S$).
**Equation 5.** Antibody is secreted by both plasma-cell populations and cleared at rate $\delta_{\text{Ab}}$.
This structure is motivated by early modelling work on immune memory [@perelson2002; @antia2005] and is consistent with the two-population interpretation of biphasic antibody waning — a fast initial drop driven by SLPC loss, followed by a slow plateau maintained by LLPCs — demonstrated empirically in [@amanna2007].
---
# Implementation
```{r model-definition}
# ODE system
withinhost_vax <- function(t, state, parms) {
  with(as.list(c(state, parms)), {
    dA  <- -delta_A  * A
    dS  <- kS * A * (1 + phi_S * M) - delta_S  * S
    dL  <- kL * A * (1 + phi_L * M) - delta_L  * L
    dM  <- eps * S                   - delta_M  * M
    dAb <- rS * S + rL * L           - delta_Ab * Ab
    list(c(dA, dS, dL, dM, dAb))
  })
}

# Parameter values
parms <- c(
  delta_A  = 0.30,   # antigen half-life  ~2.3 days
  delta_S  = 0.15,   # SLPC half-life     ~4.6 days
  delta_L  = 0.003,  # LLPC half-life     ~231 days
  delta_M  = 0.004,  # memory half-life   ~173 days
  delta_Ab = 0.018,  # antibody half-life ~39 days
  kS       = 5.0,    # SLPC stimulation rate
  kL       = 0.5,    # LLPC stimulation rate
  rS       = 2.0,    # antibody secretion: SLPC
  rL       = 5.0,    # antibody secretion: LLPC
  eps      = 0.05,   # memory generation efficiency
  phi_S    = 3.0,    # recall boost factor: SLPC
  phi_L    = 8.0     # recall boost factor: LLPC
)

state0 <- c(A = 1, S = 0, L = 0, M = 0, Ab = 0)
times  <- seq(0, 360, by = 0.5)
```
The parameters are chosen to reproduce qualitative features of mRNA vaccine immunogenicity data: a first-dose antibody peak around day 14–21, a substantially higher second-dose peak, and waning to roughly 20–30% of peak by month 6 — consistent with published BNT162b2 immunogenicity studies [@goel2021; @khoury2021]. Units are arbitrary (a.u.); the shapes and ratios are what matter at this stage.
---
# Single-dose dynamics
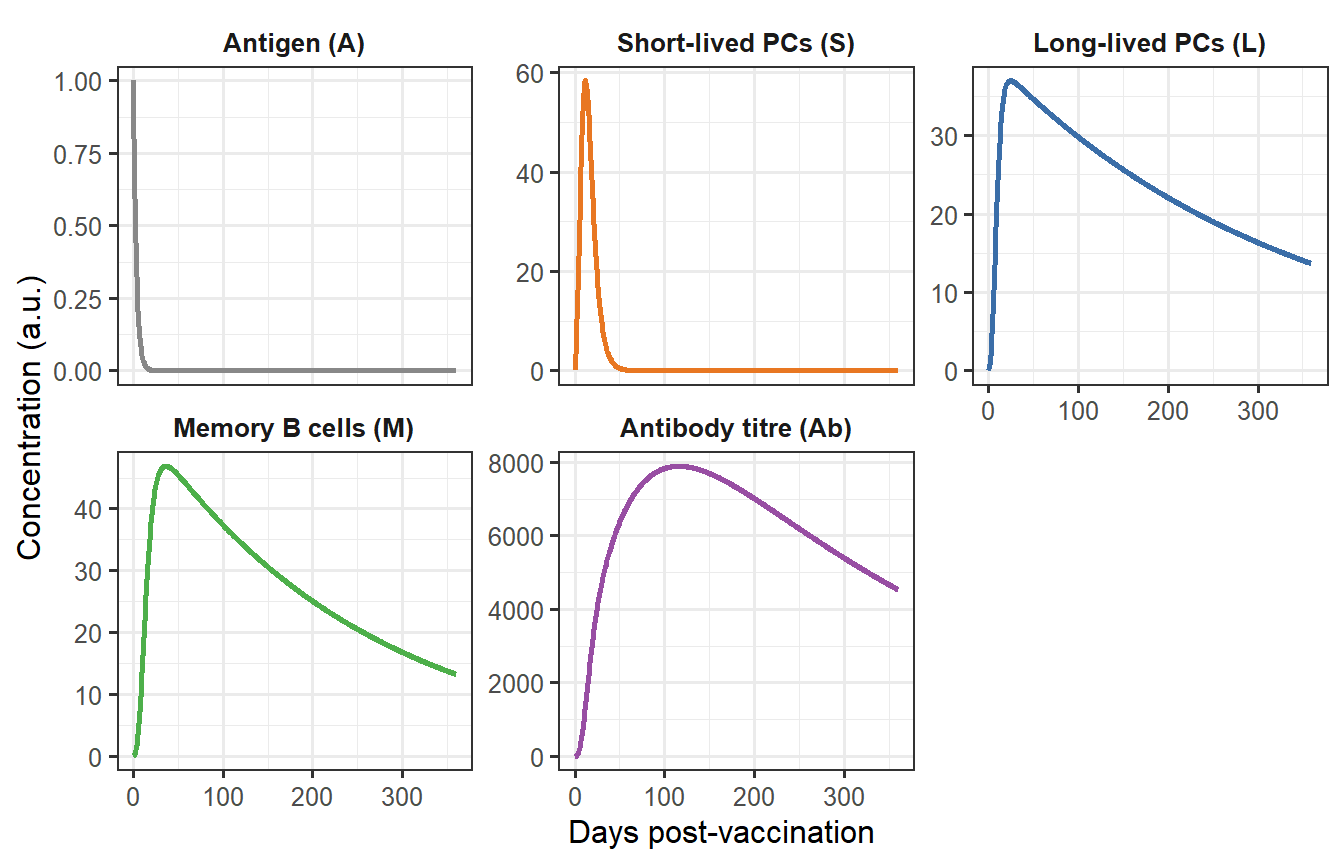
```{r immune-cascade, fig.cap="Immune cascade after a single vaccine dose. Antigen (A) decays within a week, driving a transient short-lived plasma cell (S) peak at day ~5. Long-lived plasma cells (L) and memory B cells (M) accumulate more slowly and persist. Antibody titre (Ab) mirrors the combined secretion from S and L, rising to a peak around day 18 before entering a slow decline sustained by L."}
out1 <- as.data.frame(ode(y = state0, times = times,
                           func = withinhost_vax, parms = parms))

# Facet labels
var_labels <- c(
  A   = "Antigen (A)",
  S   = "Short-lived PCs (S)",
  L   = "Long-lived PCs (L)",
  M   = "Memory B cells (M)",
  Ab  = "Antibody titre (Ab)"
)

out1_long <- out1 |>
  pivot_longer(-time, names_to = "var", values_to = "value") |>
  mutate(var = factor(var, levels = names(var_labels),
                      labels = var_labels))

pal <- c(
  "Antigen (A)"          = "#888888",
  "Short-lived PCs (S)"  = "#E87722",
  "Long-lived PCs (L)"   = "#3B6EA8",
  "Memory B cells (M)"   = "#4DAF4A",
  "Antibody titre (Ab)"  = "#984EA3"
)

ggplot(out1_long, aes(x = time, y = value, colour = var)) +
  geom_line(linewidth = 0.9) +
  facet_wrap(~var, scales = "free_y", ncol = 3) +
  scale_colour_manual(values = pal, guide = "none") +
  labs(x = "Days post-vaccination", y = "Concentration (a.u.)") +
  theme(strip.background = element_blank(),
        strip.text = element_text(face = "bold"))
```
The cascade has a clear temporal hierarchy:
- **Days 1–7**: Antigen drives a burst of SLPC production. Antibody begins to rise.
- **Days 7–21**: SLPCs decline as antigen clears. LLPCs and memory B cells continue accumulating. Antibody peaks.
- **Days 21+**: SLPC contribution to antibody fades; the titre is increasingly sustained by the small but persistent LLPC pool. Waning slows markedly once LLPCs dominate.
This biphasic waning — a fast initial drop followed by a slow plateau — is the characteristic fingerprint of a two-population plasma cell response. Vaccines that generate large LLPC pools (live-attenuated, mRNA with strong adjuvanticity) show much slower long-term waning than those that elicit primarily SLPCs.
---
# Prime-boost dynamics
Most modern vaccines use a prime-boost schedule: a second dose is given weeks after the first, by which time memory B cells have accumulated enough to mount a dramatically amplified recall response. We model this by adding a second antigen dose ($A \mathrel{+}= 1$) at day 21.
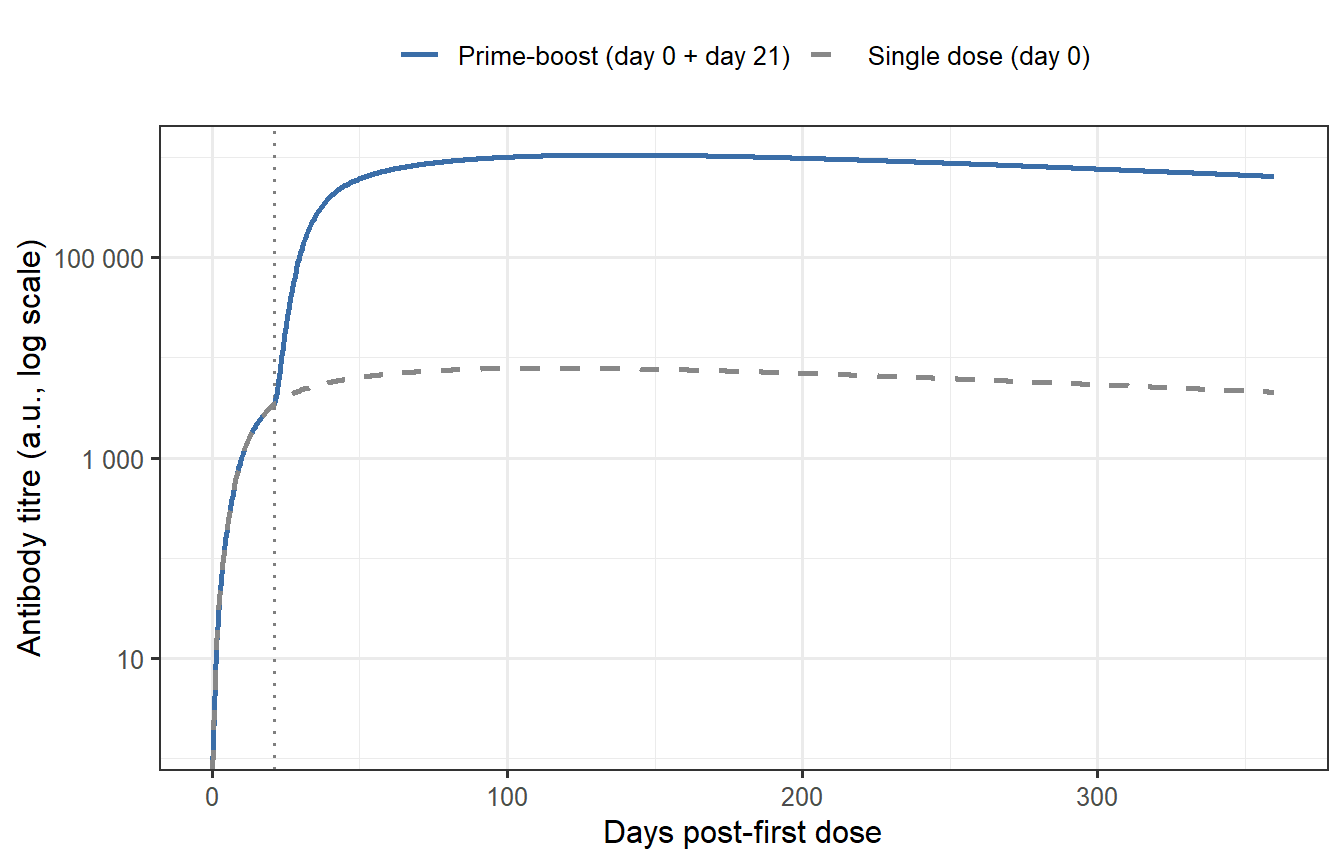
```{r prime-boost, fig.cap="Antibody kinetics: single dose (dashed) vs. prime-boost at day 21 (solid). The second dose finds a primed immune system — memory B cells (M) amplify both SLPC and LLPC production, producing a peak titre ~8–10-fold higher than dose 1 and substantially slower long-term waning. The vertical dotted line marks the day-21 boost."}
dose2_event <- data.frame(
  var    = "A",
  time   = 21,
  value  = 1,
  method = "add"
)

out2 <- as.data.frame(ode(y = state0, times = times,
                           func = withinhost_vax, parms = parms,
                           events = list(data = dose2_event)))

df_compare <- bind_rows(
  out1 |> mutate(schedule = "Single dose (day 0)"),
  out2 |> mutate(schedule = "Prime-boost (day 0 + day 21)")
) |> select(time, Ab, schedule)

ggplot(df_compare, aes(x = time, y = Ab, colour = schedule, linetype = schedule)) +
  geom_vline(xintercept = 21, linetype = "dotted", colour = "grey50", linewidth = 0.6) +
  geom_line(linewidth = 0.9) +
  scale_y_log10(labels = scales::label_number()) +
  scale_colour_manual(values = c("Single dose (day 0)"          = "#888888",
                                  "Prime-boost (day 0 + day 21)" = "#3B6EA8")) +
  scale_linetype_manual(values = c("Single dose (day 0)"          = "dashed",
                                    "Prime-boost (day 0 + day 21)" = "solid")) +
  labs(x = "Days post-first dose", y = "Antibody titre (a.u., log scale)",
       colour = NULL, linetype = NULL) +
  theme(legend.position = "top")
```
The memory amplification captured by the $(1 + \phi M)$ terms explains three features of prime-boost immunogenicity universally seen in clinical data [@goel2021]:
1. The second-dose peak is substantially higher (here ~8-fold), driven by massive SLPC expansion.
2. The plateau after dose 2 is higher (more LLPCs generated during recall), so titres remain above the single-dose level even at 12 months.
3. The response is faster — the antibody rises within days of the boost, not weeks, because memory cells differentiate into plasma cells without needing to transit through a full germinal-centre reaction.
---
# What controls waning?
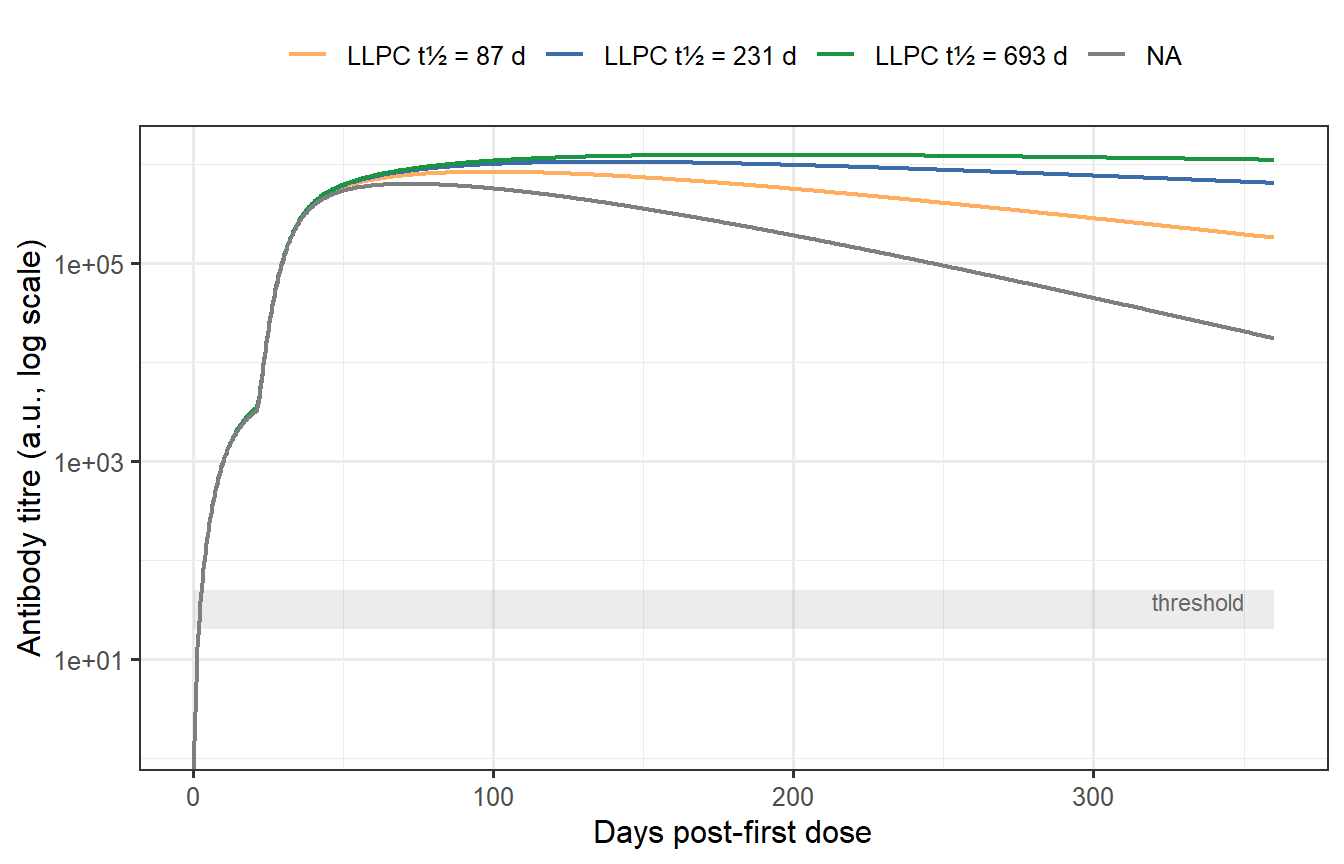
Two parameters dominate long-term antibody decay: $\delta_L$ (LLPC clearance) and $k_L / k_S$ (how much of the stimulatory signal goes to the long-lived vs short-lived pool). The figure below sweeps $\delta_L$ across a range that spans what has been measured in humans — from fast-waning responses (e.g., SARS-CoV-2 in naive individuals) to long-lived ones (e.g., measles, yellow fever) [@amanna2007].
```{r waning-sensitivity, fig.cap="Sensitivity of long-term antibody waning to LLPC clearance rate δ_L (prime-boost schedule). With a short LLPC half-life (~35 days, red), titres drop to near zero by month 6 — no persistent immunity. With a long half-life (~693 days, blue), titres remain high a year post-vaccination. The grey band marks a hypothetical protective threshold. Most mRNA vaccines fall in the intermediate range."}
delta_L_vals <- c(0.020, 0.008, 0.003, 0.001)
llpc_labels  <- c(
  "0.020" = "LLPC t½ = 35 d",
  "0.008" = "LLPC t½ = 87 d",
  "0.003" = "LLPC t½ = 231 d",
  "0.001" = "LLPC t½ = 693 d"
)
pal_waning <- c(
  "LLPC t½ = 35 d"  = "#D7191C",
  "LLPC t½ = 87 d"  = "#FDAE61",
  "LLPC t½ = 231 d" = "#3B6EA8",
  "LLPC t½ = 693 d" = "#1A9641"
)

res_list <- lapply(delta_L_vals, function(dL) {
  p2 <- parms; p2["delta_L"] <- dL
  out <- as.data.frame(ode(y = state0, times = times,
                            func = withinhost_vax, parms = p2,
                            events = list(data = dose2_event)))
  out$delta_L_label <- llpc_labels[as.character(dL)]
  out
})

df_wane <- bind_rows(res_list) |>
  mutate(delta_L_label = factor(delta_L_label, levels = llpc_labels))

ggplot(df_wane, aes(x = time, y = Ab, colour = delta_L_label)) +
  annotate("rect", xmin = 0, xmax = 360,
           ymin = 20, ymax = 50, alpha = 0.15, fill = "grey50") +
  annotate("text", x = 350, y = 38, label = "threshold", size = 3,
           hjust = 1, colour = "grey40") +
  geom_line(linewidth = 0.85) +
  scale_y_log10() +
  scale_colour_manual(values = pal_waning) +
  labs(x = "Days post-first dose", y = "Antibody titre (a.u., log scale)",
       colour = NULL) +
  theme(legend.position = "top")
```
The sensitivity analysis reveals a practical implication for trial design. A vaccine that generates primarily SLPCs might show excellent 28-day titres in a Phase 1 study but provide negligible protection by month 6. Conversely, a vaccine that elicits a large LLPC pool will show slower early kinetics but durable long-term protection. These two vaccines are nearly indistinguishable from peak-titre data alone. Identifying which compartment is dominant — and estimating $\delta_L$ per individual — is exactly what a within-host digital twin must do from limited longitudinal data.
---
# Parameters and their biological interpretation
| Parameter | Value | Biological meaning |
|---|---|---|
| $\delta_A = 0.30$ d$^{-1}$ | LLPC t½ ~2 d | Antigen cleared within ~1 week |
| $\delta_S = 0.15$ d$^{-1}$ | SLPC t½ ~5 d | Short-lived plasma cells die quickly |
| $\delta_L = 0.003$ d$^{-1}$ | LLPC t½ ~230 d | Bone-marrow plasma cells are long-lived |
| $\delta_M = 0.004$ d$^{-1}$ | Memory t½ ~170 d | Memory cells persist for years to decades |
| $\delta_{\text{Ab}} = 0.018$ d$^{-1}$ | Ab t½ ~39 d | IgG turnover in serum |
| $k_L / k_S = 0.1$ | — | 10% of stimulation goes to LLPC pool |
| $\phi_L > \phi_S$ | 8 vs 3 | Memory preferentially replenishes LLPCs on recall |
| $r_L > r_S$ | 5 vs 2 | LLPCs secrete more antibody per cell per unit time |
Antibody half-life values are broadly consistent with IgG catabolism data across vaccine antigens in [@amanna2007]. SLPC half-life is consistent with short-lived plasma cell lifespans measured *ex vivo*. LLPC half-life spans the observed range from fast-waning SARS-CoV-2 responses to longer-lived measles-vaccine-induced immunity.
---
# Limitations and what comes next
This model captures the broad strokes of humoral vaccine immunology but omits several biologically important processes:
- **CD4+ and CD8+ T cells.** T-cell help is modelled implicitly through the antigen-driven stimulation terms. Vaccines with poor T-cell immunogenicity would need this made explicit.
- **Antigen-specific B-cell precursor frequency.** The initial B-cell pool size varies among individuals and affects peak response; this heterogeneity is not represented.
- **Innate signals and adjuvants.** Different adjuvants (AS01, MF59, alum, lipid nanoparticle) change the kinetics of dendritic-cell activation and germinal-centre seeding, effectively altering $k_S$, $k_L$, and the timing parameters. The model could be extended with an innate-activation compartment.
- **Waning from bone-marrow niche competition.** Long-lived plasma cell survival depends on occupancy of specialised bone-marrow niches; the model treats $\delta_L$ as constant, ignoring this density-dependence.
Despite these simplifications, the two-population plasma-cell model is the standard starting point in quantitative vaccine pharmacology [@dasti2025; @tarning2023]. It has enough structure to be calibrated to individual patient data (longitudinal antibody measurements) and enough flexibility to represent the spectrum from fast-waning to durable immunity.
**Post 2** will take the antibody trajectory from this model and ask: *at what titre does a given level of antibody actually protect from infection?* That question — the correlate of protection — is the second building block of the digital twin.
---
# References {.unnumbered}
::: {#refs}
:::
```{r session-info, echo=FALSE}
sessionInfo()
```