Physics-Informed Neural Networks for Epidemic Modeling

Fitting SIR dynamics and recovering transmission parameters with a physics-constrained network

PINN
SIR
epidemiology
Python
deep learning
Author

Jong-Hoon Kim

Published

April 9, 2026

1 From neural ODEs to PINNs: a brief history

The idea of using neural networks to solve differential equations predates deep learning. Lagaris et al. (1) showed in 1998 that a simple feedforward network, trained to minimise the residual of an ODE or PDE, can approximate solutions across a spatial or temporal domain. The key insight: automatic differentiation makes the ODE residual a differentiable loss term, enabling gradient-based training with no numerical solver.

Raissi et al. (2) formalised this as Physics-Informed Neural Networks: embedding known governing equations — ODEs, PDEs, integral equations, or any physical constraint — directly into the loss function. Their framework covered:

  • Forward problems — given parameters and initial conditions, solve for the solution trajectory; the PINN provides a mesh-free, differentiable approximation.
  • Inverse problems — given noisy observations, infer unknown parameters; \(\beta\) and \(\gamma\) are treated as additional learnable parameters alongside the network weights.

The paper demonstrated PINNs on canonical fluid-dynamics problems (Navier–Stokes, Burgers equation).

2 PINNs in epidemiology and infectious diseases

Recent work has extended PINNs to:

  • Multi-wave dynamics — multi-phase PINNs that switch physics regimes across intervention periods, capturing policy-driven changes in \(\beta\) (3).
  • Fractional-order models — incorporating memory effects through fractional derivatives to better match empirical epidemic decay curves (4).
  • Uncertainty quantification — Bayesian PINN extensions that propagate uncertainty in parameters through to forecast intervals (5).

A recurring theme is that the physics residual acts as a regulariser: penalising ODE violations prevents the network from overfitting noisy observations, so inferred parameters reflect the underlying epidemic dynamics rather than noise.

Below, I use the SIR model to demonstrate how PINNs work in practice.

Tip

What you need

pip install torch scipy matplotlib numpy

Code tested with: torch 2.11, scipy 1.17, Python 3.11.


3 The SIR model

The SIR model partitions a closed population of size \(N\) into:

  • \(S(t)\): Susceptible — not yet infected
  • \(I(t)\): Infectious — currently infected and able to transmit
  • \(R(t)\): Recovered — immune (or deceased)

The dynamics are:

\[ \frac{dS}{dt} = -\frac{\beta S I}{N}, \qquad \frac{dI}{dt} = \frac{\beta S I}{N} - \gamma I, \qquad \frac{dR}{dt} = \gamma I \]

Parameter Meaning Units
\(\beta\) transmission rate contacts / day × probability / contact
\(\gamma\) recovery rate 1 / day
\(R_0 = \beta/\gamma\) basic reproduction number dimensionless

Throughout this post we use \(\beta = 0.3\), \(\gamma = 0.1\) (\(R_0 = 3\)) as the data-generating truth.


4 Simulate ground truth and noisy observations

Code
import numpy as np
import torch
import torch.nn as nn
from scipy.integrate import odeint as scipy_odeint
import matplotlib.pyplot as plt

# Reproducibility
torch.manual_seed(42)
np.random.seed(42)

plt.rcParams.update({
    "figure.dpi": 130,
    "axes.spines.top": False,
    "axes.spines.right": False,
    "axes.grid": True,
    "grid.alpha": 0.3,
    "font.size": 8,
    "axes.titlesize": 8,
    "axes.labelsize": 8,
    "xtick.labelsize": 7,
    "ytick.labelsize": 7,
    "legend.fontsize": 7,
})

C_S, C_I, C_R   = "#2196F3", "#F44336", "#4CAF50"
C_OBS, C_PINN   = "black", "#9C27B0"

# --- Ground truth parameters ---
N          = 1_000
beta_true  = 0.3
gamma_true = 0.1
T_max      = 60.0

y0 = np.array([990.0, 10.0, 0.0])

def sir_rhs(y, t, beta, gamma, N):
    S, I, R = y
    return [-beta*S*I/N, beta*S*I/N - gamma*I, gamma*I]

n_grid = 100
t_grid = np.linspace(0, T_max, n_grid)
sol    = scipy_odeint(sir_rhs, y0, t_grid, args=(beta_true, gamma_true, N))
S_true, I_true, R_true = sol.T

print(f"R₀ = {beta_true/gamma_true:.1f}")
print(f"Peak infections: {I_true.max():.0f} on day {t_grid[I_true.argmax()]:.1f}")
print(f"Final susceptibles: {S_true[-1]:.0f}")

# --- Sparse, noisy observations of I(t) only ---
n_obs   = 30
obs_idx = np.sort(np.random.choice(np.arange(1, n_grid), n_obs, replace=False))
t_obs   = t_grid[obs_idx]
I_obs   = np.clip(I_true[obs_idx] + np.random.normal(0, 20.0, n_obs), 0, N)

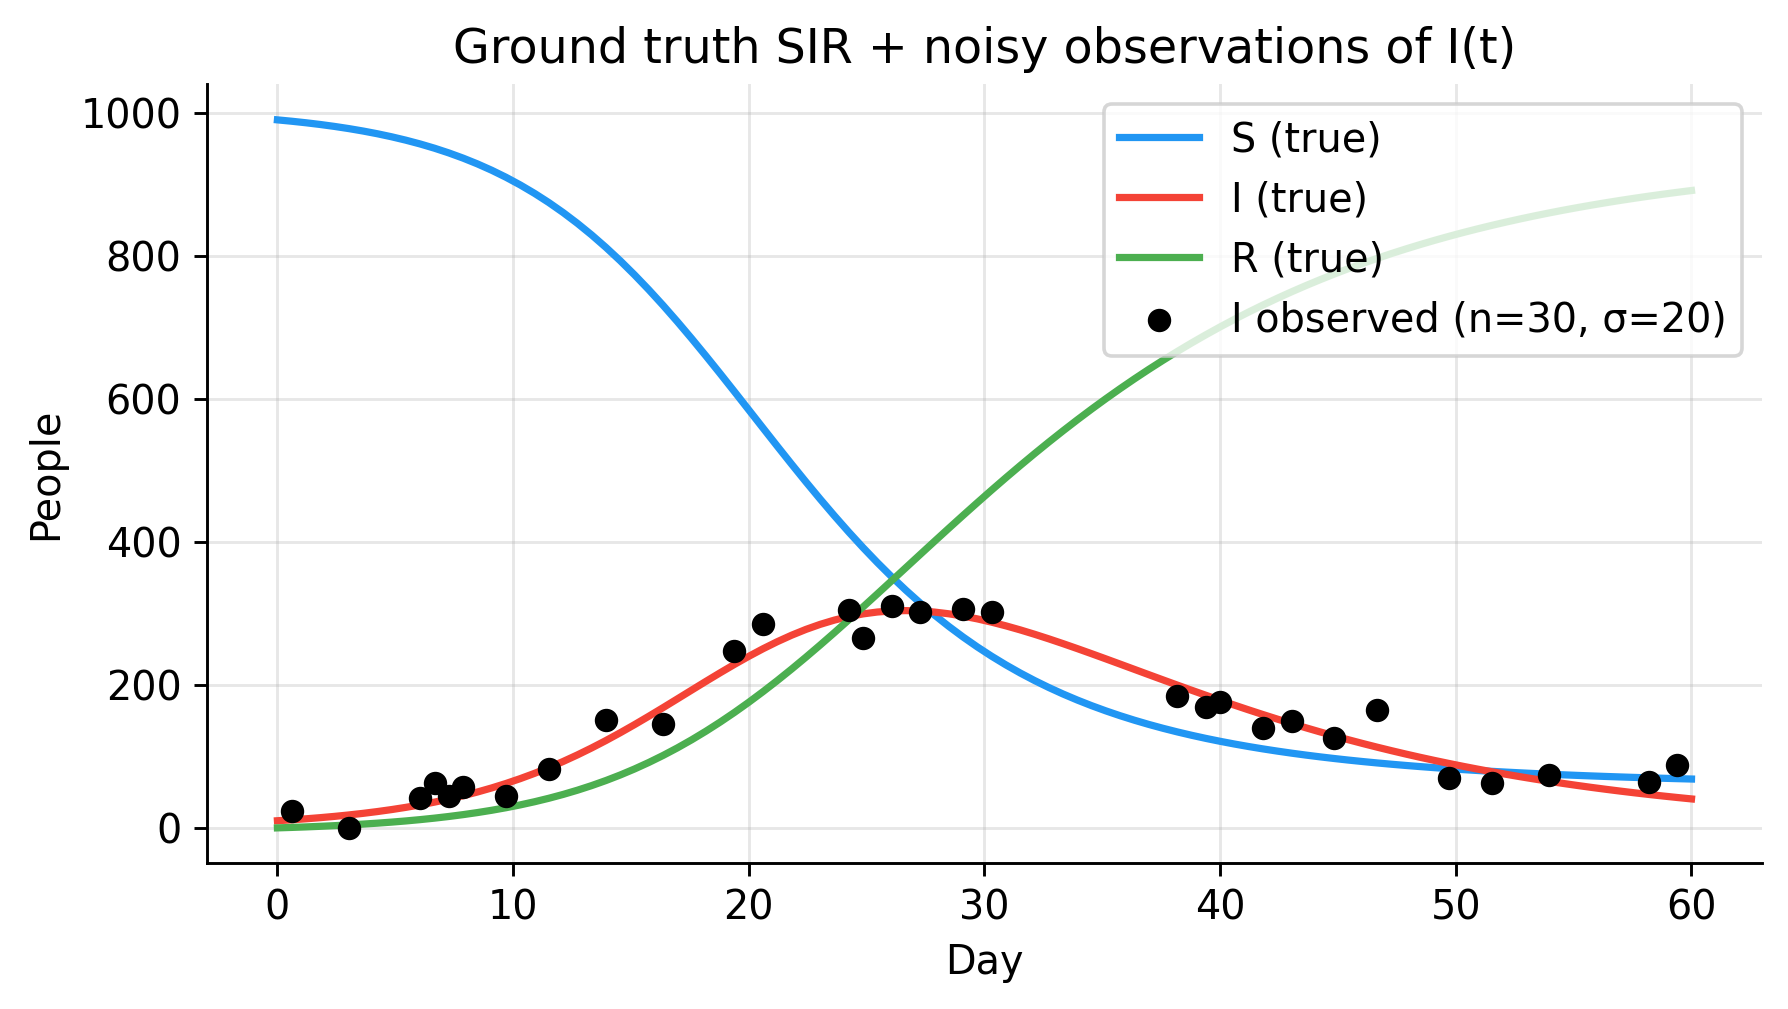
fig, ax = plt.subplots(figsize=(5, 3))
ax.plot(t_grid, S_true, color=C_S, lw=2, label="S (true)")
ax.plot(t_grid, I_true, color=C_I, lw=2, label="I (true)")
ax.plot(t_grid, R_true, color=C_R, lw=2, label="R (true)")
ax.scatter(t_obs, I_obs, color=C_OBS, s=30, zorder=5,
           label=f"I observed (n={n_obs}, σ=20)")
ax.set(xlabel="Day", ylabel="People",
       title="Ground truth SIR + noisy observations of I(t)")
ax.legend(loc="upper right")
plt.tight_layout()
plt.show()
R₀ = 3.0
Peak infections: 304 on day 26.7
Final susceptibles: 68

Only the black dots are available for training. The full \(S\), \(I\), \(R\) trajectories are hidden from the model.


5 Physics-Informed Neural Network

5.1 Architecture

A PINN maps scaled time \(t_s \in [0,1]\) directly to the three compartment proportions \((S/N, I/N, R/N)\):

\[ (S(t),\, I(t),\, R(t)) / N \;=\; \text{NN}_\theta(t/T_{\max}) \]

Two scalars — \(\log\beta_s\) and \(\log\gamma_s\) — are learnable parameters alongside the network weights. Physical rates are recovered as \(\beta = \beta_s / T_{\max}\), \(\gamma = \gamma_s / T_{\max}\).

Code
class PINN(nn.Module):
    """
    Physics-Informed Neural Network for the SIR model.

    Input  : scaled time t_s ∈ [0, 1]   — shape (batch,)
    Output : (S, I, R) / N proportions  — shape (batch, 3)

    Learnable epidemic parameters
    -----------------------------
    log_beta_s, log_gamma_s : log of β and γ in scaled-time units.
        Physical rates: β = exp(log_beta_s) / T_max
    """
    def __init__(self, hidden: int = 64, depth: int = 4):
        super().__init__()
        layers = [nn.Linear(1, hidden), nn.Tanh()]
        for _ in range(depth - 1):
            layers += [nn.Linear(hidden, hidden), nn.Tanh()]
        layers += [nn.Linear(hidden, 3), nn.Sigmoid()]
        self.net = nn.Sequential(*layers)

        # Initialise near plausible values
        # True scaled params: β_s = 0.3 × 60 = 18, γ_s = 0.1 × 60 = 6
        self.log_beta_s  = nn.Parameter(torch.tensor(np.log(10.0)))
        self.log_gamma_s = nn.Parameter(torch.tensor(np.log( 3.0)))

    @property
    def beta_s(self):    return torch.exp(self.log_beta_s)
    @property
    def gamma_s(self):   return torch.exp(self.log_gamma_s)
    @property
    def beta_phys(self): return self.beta_s  / T_max
    @property
    def gamma_phys(self):return self.gamma_s / T_max
    @property
    def R0_est(self):    return self.beta_s  / self.gamma_s   # scale-invariant

    def forward(self, t_s):
        return self.net(t_s.view(-1, 1))   # (batch, 3)

5.2 Loss functions

Training minimises a composite loss:

\[ \mathcal{L} = \underbrace{\mathcal{L}_\text{data}}_{\text{fit I observations}} + \lambda_\phi \underbrace{\mathcal{L}_\text{physics}}_{\text{SIR residuals via autograd}} + \lambda_0 \underbrace{\mathcal{L}_\text{IC}}_{\text{initial conditions}} \]

The data loss \(\mathcal{L}_\text{data}\) is the MSE between predicted \(I(t)\) and the 30 noisy observations — the only signal available.

The physics loss \(\mathcal{L}_\text{physics}\) evaluates the SIR residuals at 200 collocation points via automatic differentiation. In scaled time \(t_s = t/T_{\max}\), the ODEs become:

\[ \frac{dS}{dt_s} = -\beta_s S I, \qquad \frac{dI}{dt_s} = \beta_s S I - \gamma_s I, \qquad \frac{dR}{dt_s} = \gamma_s I \]

The initial-condition loss \(\mathcal{L}_\text{IC}\) anchors the network to the known state at \(t = 0\), preventing drift to arbitrary solutions.

Code
def data_loss(model, t_obs_s, I_obs_s):
    """MSE on the I compartment at observed time points."""
    sir = model(t_obs_s)
    return ((sir[:, 1] - I_obs_s) ** 2).mean()


def physics_loss(model, t_col_base):
    """
    SIR residuals at collocation points via automatic differentiation.
    Operates entirely in scaled time — no solver required.
    """
    t = t_col_base.clone().requires_grad_(True)
    sir = model(t)
    S, I, R = sir[:, 0], sir[:, 1], sir[:, 2]

    ones = torch.ones(len(t))
    dS = torch.autograd.grad(S, t, grad_outputs=ones, create_graph=True)[0]
    dI = torch.autograd.grad(I, t, grad_outputs=ones, create_graph=True)[0]
    dR = torch.autograd.grad(R, t, grad_outputs=ones, create_graph=True)[0]

    b, g = model.beta_s, model.gamma_s
    res_S = dS + b * S * I
    res_I = dI - b * S * I + g * I
    res_R = dR - g * I

    return (res_S**2 + res_I**2 + res_R**2).mean()


def ic_loss(model, y0_s):
    """Match (S0, I0, R0)/N at t = 0."""
    sir0 = model(torch.tensor([0.0]))[0]
    return ((sir0 - y0_s) ** 2).mean()
Note

Why collocation points?

The physics loss is evaluated on a dense grid of 200 collocation points spanning \([0, T_{\max}]\), separate from the 30 observation times. This ensures the SIR residual is penalised everywhere — not just where data exist — allowing physics knowledge to constrain the solution between and beyond observations.

5.3 Training

Code
# Tensors — everything scaled to [0, 1]
t_obs_s = torch.tensor(t_obs / T_max, dtype=torch.float32)
I_obs_s = torch.tensor(I_obs / N,     dtype=torch.float32)
y0_s    = torch.tensor(y0   / N,      dtype=torch.float32)
t_col   = torch.linspace(0, 1, 200)

# Loss weights
lam_phys = 0.1
lam_ic   = 5

pinn        = PINN(hidden=64, depth=4)
opt         = torch.optim.Adam(pinn.parameters(), lr=1e-3)
sched       = torch.optim.lr_scheduler.StepLR(opt, step_size=2000, gamma=0.5)

losses     = []
beta_hist  = []
gamma_hist = []

for epoch in range(6_000):
    opt.zero_grad()

    L_data  = data_loss(pinn, t_obs_s, I_obs_s)
    L_phys  = physics_loss(pinn, t_col)
    L_ic    = ic_loss(pinn, y0_s)
    loss    = L_data + lam_phys * L_phys + lam_ic * L_ic

    loss.backward()
    nn.utils.clip_grad_norm_(pinn.parameters(), max_norm=1.0)
    opt.step()
    sched.step()

    losses.append(loss.item())
    beta_hist.append(pinn.beta_phys.item())
    gamma_hist.append(pinn.gamma_phys.item())

print(f"True:      β = {beta_true:.3f}, γ = {gamma_true:.3f}, R₀ = {beta_true/gamma_true:.2f}")
print(f"PINN est.: β = {pinn.beta_phys.item():.3f}, "
      f"γ = {pinn.gamma_phys.item():.3f}, "
      f"R₀ = {pinn.R0_est.item():.2f}")
True:      β = 0.300, γ = 0.100, R₀ = 3.00
PINN est.: β = 0.295, γ = 0.098, R₀ = 3.01

6 Results

6.1 Trajectory reconstruction

Code
t_viz_np = np.linspace(0, T_max, 300)
t_viz_s  = torch.tensor(t_viz_np / T_max, dtype=torch.float32)

with torch.no_grad():
    pred = pinn(t_viz_s).numpy() * N

sol_viz = scipy_odeint(sir_rhs, y0, t_viz_np, args=(beta_true, gamma_true, N))

fig, axes = plt.subplots(1, 2, figsize=(5, 3))

# Left: compartment trajectories
ax = axes[0]
for i, (label, color, true) in enumerate(
    [("S", C_S, sol_viz[:,0]), ("I", C_I, sol_viz[:,1]), ("R", C_R, sol_viz[:,2])]
):
    ax.plot(t_viz_np, true,       color=color, lw=2, ls="--", alpha=0.5,
            label=f"{label} true")
    ax.plot(t_viz_np, pred[:, i], color=color, lw=2,
            label=f"{label} PINN")
ax.scatter(t_obs, I_obs, color=C_OBS, s=25, zorder=5, label="I observed")
ax.set(xlabel="Day", ylabel="People",
       title="PINN — compartment reconstruction")
ax.legend(ncol=2)

# Right: training loss
ax = axes[1]
ax.semilogy(losses, color=C_PINN, lw=1.5)
ax.set(xlabel="Epoch", ylabel="Total loss (log scale)",
       title="PINN — training curve")

plt.tight_layout()
plt.show()

The PINN fits the observed \(I(t)\) points and simultaneously reconstructs the latent \(S(t)\) and \(R(t)\) trajectories. The physics loss ensures the SIR equations are satisfied everywhere, not just at the observation times.

6.2 Effect of the physics loss weight

The weight \(\lambda_\phi\) balances data fidelity against physics enforcement. Below we vary it over several orders of magnitude and examine the effect on the fit and parameter estimates.

Code
lam_values  = [0.0, 0.01, 0.1, 1.0]
lam_labels  = [f"λ={v}" for v in lam_values]
colors_lam  = ["#E91E63", "#FF9800", "#9C27B0", "#009688"]

fig, axes = plt.subplots(1, 2, figsize=(5, 3))

for lam, label, col in zip(lam_values, lam_labels, colors_lam):
    torch.manual_seed(42)
    m   = PINN(hidden=64, depth=4)
    opt_= torch.optim.Adam(m.parameters(), lr=1e-3)
    sch_= torch.optim.lr_scheduler.StepLR(opt_, step_size=2000, gamma=0.5)

    for _ in range(6_000):
        opt_.zero_grad()
        L = (data_loss(m, t_obs_s, I_obs_s)
             + lam * physics_loss(m, t_col)
             + lam_ic * ic_loss(m, y0_s))
        L.backward()
        nn.utils.clip_grad_norm_(m.parameters(), 1.0)
        opt_.step(); sch_.step()

    with torch.no_grad():
        p = m(t_viz_s).numpy() * N
    axes[0].plot(t_viz_np, p[:, 1], color=col, lw=1.8, label=label)
    axes[1].scatter([lam if lam > 0 else 1e-3],
                    [m.beta_phys.item()], color=col, s=40, zorder=5)
    axes[1].scatter([lam if lam > 0 else 1e-3],
                    [m.gamma_phys.item()], color=col, marker="D", s=40, zorder=5)

axes[0].plot(t_viz_np, sol_viz[:, 1], color=C_I, lw=2, ls="--",
             alpha=0.6, label="I true")
axes[0].scatter(t_obs, I_obs, color=C_OBS, s=20, zorder=5, label="Observed")
axes[0].set(xlabel="Day", ylabel="Infectious I", title="I(t) fit vs. λ_phys")
axes[0].legend()

axes[1].axhline(beta_true,  color=C_I, lw=1.5, ls="--", label=f"β true={beta_true}")
axes[1].axhline(gamma_true, color=C_R, lw=1.5, ls="--", label=f"γ true={gamma_true}")
axes[1].set(xscale="log", xlabel="λ_phys", ylabel="Estimated parameter",
            title="Parameter recovery vs. λ_phys")
axes[1].legend()

plt.tight_layout()
plt.show()

At \(\lambda_\phi = 0\) the network is a pure data-fitter and parameter recovery collapses. Increasing \(\lambda_\phi\) pulls estimates toward the true values; too large a weight sacrifices data fit. Here, \(\lambda_\phi \approx 0.1\) gives a reasonable balance.

6.3 Parameter recovery during training

Code
fig, axes = plt.subplots(1, 2, figsize=(5, 3))

for ax, hist, true_val, label, color in [
    (axes[0], beta_hist,  beta_true,  "β (transmission rate)", C_I),
    (axes[1], gamma_hist, gamma_true, "γ (recovery rate)",     C_R),
]:
    ax.plot(hist, color=color, lw=1.5, label="PINN estimate")
    ax.axhline(true_val, color="black", lw=1.5, ls="--",
               label=f"True = {true_val}")
    ax.set(xlabel="Epoch", ylabel=label,
           title=f"Parameter recovery: {label}")
    ax.legend()

plt.tight_layout()
plt.show()

print(f"\nParameter recovery summary")
print(f"  β  — true: {beta_true:.3f}  |  estimated: {pinn.beta_phys.item():.3f}")
print(f"  γ  — true: {gamma_true:.3f}  |  estimated: {pinn.gamma_phys.item():.3f}")
print(f"  R₀ — true: {beta_true/gamma_true:.2f}  |  estimated: {pinn.R0_est.item():.2f}")


Parameter recovery summary
  β  — true: 0.300  |  estimated: 0.295
  γ  — true: 0.100  |  estimated: 0.098
  R₀ — true: 3.00  |  estimated: 3.01

7 What the PINN gives you

Property Value
Fits \(I(t)\) observations
Reconstructs \(S(t)\), \(R(t)\) without observing them
Recovers \(\beta\), \(\gamma\) jointly
Enforces \(S+I+R \approx N\) ✓ (via IC + physics loss)
Extrapolates beyond training window Better than unconstrained networks
Requires an ODE solver during training ✗ (only autograd needed)
Black-box right-hand side ✗ (mechanistic residuals are explicit)

8 Extensions worth exploring

Uncertainty quantification

  • Bayesian PINN: place priors on \(\beta\) and \(\gamma\) and use MCMC (e.g. NUTS in NumPyro) or variational inference to obtain posterior credible intervals.
  • Ensemble PINNs: train multiple networks from different random initialisations and use the spread as a proxy for epistemic uncertainty.

Identifiability and multi-wave dynamics

  • Not all parameters are jointly identifiable from \(I(t)\) alone. Kharazmi et al. (4) provide a PINN-based identifiability analysis framework applicable to SIR extensions.
  • Multi-phase PINNs split the time axis at known intervention dates and fit separate physics terms per phase, making them well-suited to multi-wave outbreaks.

9 References

1.
Lagaris IE, Likas A, Fotiadis DI. Artificial neural networks for solving ordinary and partial differential equations. IEEE Transactions on Neural Networks. 1998;9(5):987–1000. doi:10.1109/72.712178
2.
Raissi M, Perdikaris P, Karniadakis GE. Physics-informed neural networks: A deep learning framework for solving forward and inverse problems involving nonlinear partial differential equations. Journal of Computational Physics. 2019;378:686–707. doi:10.1016/j.jcp.2018.10.045
3.
He M, Tang B, Xiao Y, Tang S. Transmission dynamics informed neural network with application to COVID-19 infections. Computers in Biology and Medicine. 2023;165:107431. doi:10.1016/j.compbiomed.2023.107431
4.
Kharazmi E, Cai M, Zheng X, Zhang Z, Lin G, Karniadakis GE. Identifiability and predictability of integer- and fractional-order epidemiological models using physics-informed neural networks. Nature Computational Science. 2021;1(11):744–53. doi:10.1038/s43588-021-00158-0
5.
Linka K, Schäfer A, Meng X, Zou Z, Karniadakis GE, Kuhl E. Bayesian physics informed neural networks for real-world nonlinear dynamical systems. Computer Methods in Applied Mechanics and Engineering. 2022;402:115346. doi:10.1016/j.cma.2022.115346
Python     3.12.10
torch      2.11.0+cpu
scipy      1.17.1
matplotlib 3.10.8