Using LLMs in Production: Automated Epidemic Intelligence Reports

A language model can turn a table of model outputs into a plain-language health advisory in seconds. The skill is structuring the prompt and wiring the API into your pipeline.

machine learning
LLM
prompt engineering
API
public health
R
Author

Jong-Hoon Kim

Published

April 24, 2026

1 The last mile of epidemic intelligence

Your digital twin produces R-effective estimates, 30-day case forecasts, and intervention scenarios — but the output is a dataframe. The epidemiologist at a health department needs a narrative: what does this mean, what should we do, and by when?

Writing that narrative manually for 20 districts every Monday morning is a bottleneck. LLMs solve this: give the model structured data and a role, and it produces a plain-language advisory that a non-technical public health official can act on immediately.

This post covers three skills: structuring prompts for reliable output (1), calling the Anthropic and OpenAI APIs from Python and R, and validating LLM output before sending it to a client.

2 Prompt engineering for structured health reports

LLMs are sensitive to prompt structure. The pattern that works consistently for data-to-text generation is:

  1. System role: tell the model who it is and what it must produce
  2. Context block: the structured data (JSON or a compact table)
  3. Instruction: what to write, how long, what to include/exclude
  4. Format constraint: JSON, markdown, or plain text
# Prompt template for epidemic advisory (conceptual — not executed)
SYSTEM_PROMPT = """
You are an epidemiologist writing briefings for district public health officers.
Write concisely. Cite the numbers. Never speculate beyond the data provided.
Always end with a 3-bullet action list.
"""

def build_prompt(district_data: dict) -> str:
    return f"""
## Situation data for {district_data['district']}
- Date: {district_data['date']}
- R_effective (median, 90% CI): {district_data['Re_median']} ({district_data['Re_lo']}{district_data['Re_hi']})
- 30-day case forecast (median): {district_data['forecast_30d']}
- Vaccination coverage: {district_data['vax_pct']}%
- Trend: {district_data['trend']}  # 'rising', 'stable', 'declining'

Write a 150-word situation report for the district health officer.
End with three concrete action items.
"""

The key discipline: keep the data compact and the instruction unambiguous. Long, vague prompts produce long, vague outputs.

3 Calling the API from Python

# Anthropic API call (conceptual — not executed)
import anthropic
import json

client = anthropic.Anthropic(api_key=os.environ["ANTHROPIC_API_KEY"])

def generate_sitrep(district_data: dict) -> str:
    message = client.messages.create(
        model   = "claude-opus-4-7",
        max_tokens = 400,
        system  = SYSTEM_PROMPT,
        messages = [{"role": "user", "content": build_prompt(district_data)}]
    )
    return message.content[0].text

# Generate reports for all districts
districts = fetch_current_model_outputs()   # from TimescaleDB (Skill 6)
reports   = {d["district"]: generate_sitrep(d) for d in districts}

At roughly $0.015 per 1,000 output tokens and ~200 tokens per report, 20 district reports cost under $0.10 — negligible compared to the analyst time saved.

4 Calling the API from R

# httr2-based API call (conceptual — not executed)
library(httr2)
library(jsonlite)

generate_sitrep_r <- function(district_data, api_key = Sys.getenv("ANTHROPIC_API_KEY")) {
  body <- list(
    model      = "claude-opus-4-7",
    max_tokens = 400,
    system     = SYSTEM_PROMPT,
    messages   = list(list(role = "user", content = build_prompt(district_data)))
  )
  resp <- request("https://api.anthropic.com/v1/messages") |>
    req_headers(
      "x-api-key"         = api_key,
      "anthropic-version" = "2023-06-01",
      "content-type"      = "application/json"
    ) |>
    req_body_json(body) |>
    req_perform()
  resp_body_json(resp)$content[[1]]$text
}

5 Simulating the full pipeline in R

Even without an API key, we can build the full pipeline and substitute a template-based fallback for the LLM call — making the pipeline testable end-to-end.

set.seed(1)

# Simulate model outputs for 6 districts
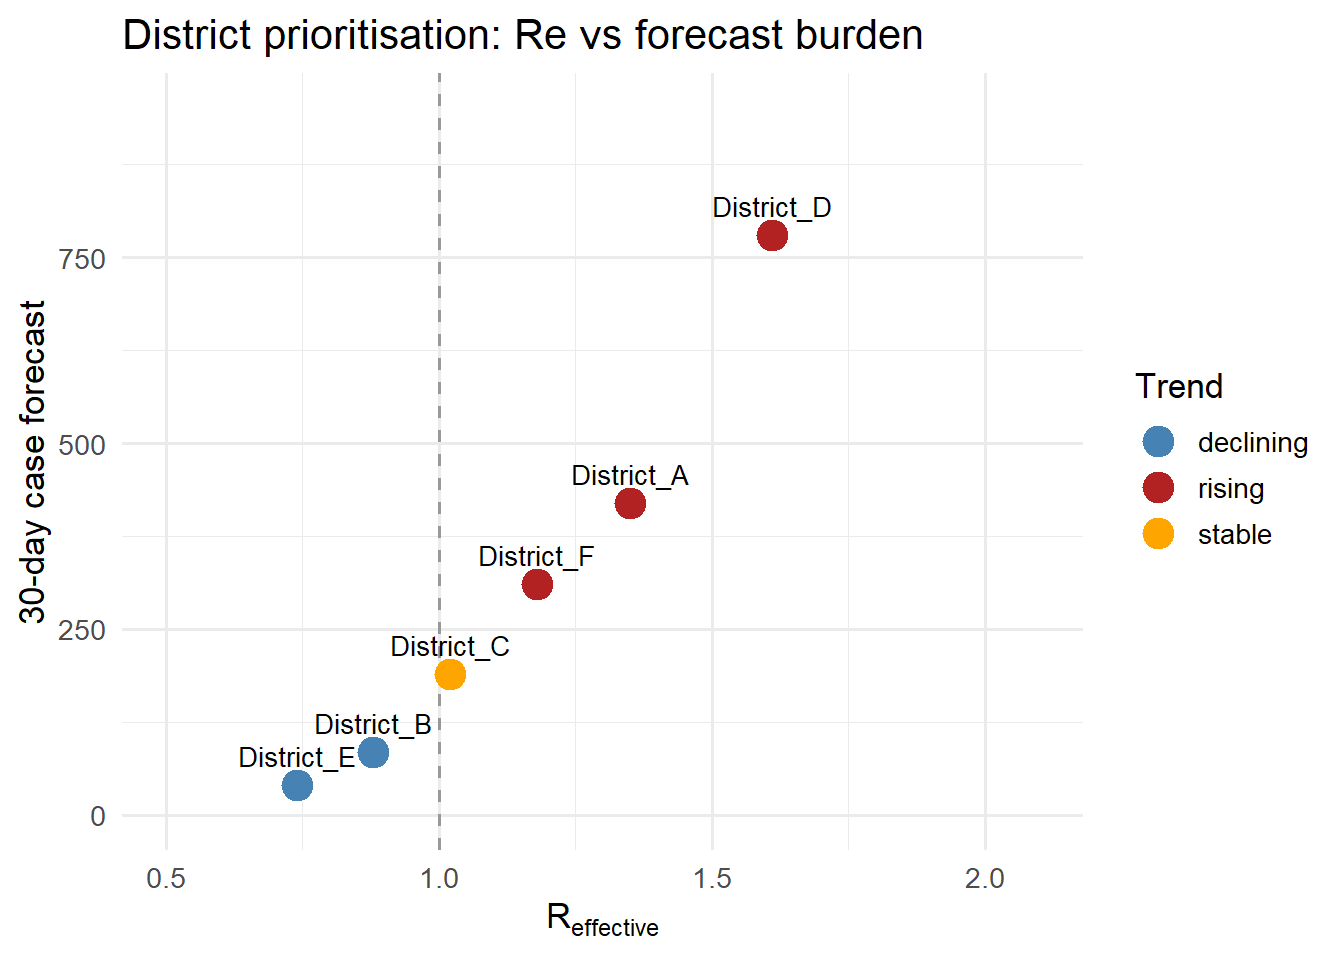
districts <- data.frame(
  district   = paste0("District_", LETTERS[1:6]),
  Re_median  = round(c(1.35, 0.88, 1.02, 1.61, 0.74, 1.18), 2),
  Re_lo      = round(c(1.10, 0.72, 0.85, 1.30, 0.55, 0.95), 2),
  Re_hi      = round(c(1.62, 1.07, 1.22, 1.98, 0.96, 1.44), 2),
  forecast_30d = c(420, 85, 190, 780, 40, 310),
  vax_pct    = c(62, 81, 74, 55, 88, 70),
  stringsAsFactors = FALSE
)
districts$trend <- ifelse(districts$Re_median > 1.1, "rising",
                   ifelse(districts$Re_median < 0.9, "declining", "stable"))

# Template-based fallback (no API needed)
template_sitrep <- function(row) {
  status <- switch(row$trend,
    rising   = paste0("ALERT: R_eff = ", row$Re_median, " (", row$Re_lo, "–",
                      row$Re_hi, "), indicating sustained growth."),
    declining = paste0("IMPROVING: R_eff = ", row$Re_median, " (", row$Re_lo,
                       "–", row$Re_hi, "), transmission declining."),
    paste0("STABLE: R_eff = ", row$Re_median, " (", row$Re_lo, "–",
           row$Re_hi, "), situation stable.")
  )
  vax_note <- if (row$vax_pct < 65) "Vaccination coverage below 65% — accelerate campaign." else
              "Vaccination coverage adequate."
  paste0(row$district, " | ", Sys.Date(), "\n",
         status, "\n",
         "30-day forecast: ", row$forecast_30d, " cases. ",
         vax_note)
}

# Generate all reports
reports <- lapply(seq_len(nrow(districts)), function(i) {
  template_sitrep(districts[i, ])
})
names(reports) <- districts$district

cat(reports[["District_A"]], "\n\n")
District_A | 2026-04-23
ALERT: R_eff = 1.35 (1.1–1.62), indicating sustained growth.
30-day forecast: 420 cases. Vaccination coverage below 65% — accelerate campaign. 
cat(reports[["District_D"]], "\n")
District_D | 2026-04-23
ALERT: R_eff = 1.61 (1.3–1.98), indicating sustained growth.
30-day forecast: 780 cases. Vaccination coverage below 65% — accelerate campaign. 
library(ggplot2)

ggplot(districts, aes(x = Re_median, y = forecast_30d,
                      colour = trend, label = district)) +
  geom_vline(xintercept = 1, linetype = "dashed", colour = "grey60") +
  geom_point(size = 5) +
  geom_text(vjust = -0.9, size = 3.5, colour = "black") +
  scale_colour_manual(
    values = c(rising = "firebrick", stable = "orange", declining = "steelblue"),
    name = "Trend"
  ) +
  scale_x_continuous(limits = c(0.5, 2.1)) +
  scale_y_continuous(limits = c(0, 950)) +
  labs(x = expression(R[effective]),
       y = "30-day case forecast",
       title = "District prioritisation: Re vs forecast burden") +
  theme_minimal(base_size = 13)

District prioritisation matrix: R_effective vs 30-day case forecast. Districts in the top-right quadrant (high Re AND high absolute burden) get the most urgent advisories. This is the figure that would accompany the LLM-generated weekly briefing.

6 Validating LLM output

LLMs occasionally hallucinate numbers. Before sending a generated report to a client, validate that the numbers in the text match the source data:

# Output validation (conceptual — not executed)
import re

def validate_report(report_text: str, district_data: dict) -> bool:
    """Check that Re median in the generated text matches the source data."""
    matches = re.findall(r"R_eff\w*\s*=\s*([\d.]+)", report_text)
    if not matches:
        return False
    reported_re = float(matches[0])
    return abs(reported_re - district_data["Re_median"]) < 0.05

# Regenerate if validation fails (with a cap on retries)
MAX_RETRIES = 3
for i in range(MAX_RETRIES):
    report = generate_sitrep(district_data)
    if validate_report(report, district_data):
        break

7 Chain-of-thought for complex scenarios

For multi-step reasoning (e.g., selecting among intervention scenarios), chain-of-thought prompting (1) dramatically improves accuracy:

# Chain-of-thought prompt addition (conceptual)
COT_SUFFIX = """
Think step by step:
1. Assess current transmission trajectory
2. Identify the binding constraint (coverage gap, surveillance deficit, or imported cases)
3. Match the intervention to the constraint
4. State the recommended action and expected impact
"""

Adding this suffix to the prompt causes the model to reason before answering, reducing the rate of internally inconsistent recommendations.

8 References

1.
Wei J, Wang X, Schuurmans D, Bosma M, Ichter B, Xia F, et al. Chain-of-thought prompting elicits reasoning in large language models. In: Advances in neural information processing systems [Internet]. 2022. Available from: https://arxiv.org/abs/2201.11903