---
title: "Game Theory for Infectious Disease Modeling"
subtitle: "When individually rational vaccination decisions fall short of the social optimum"
author: "Jong-Hoon Kim"
date: "2026-04-20"
categories: [game theory, vaccination, SIR, epidemiology, R, evolutionary games]
bibliography: references.bib
csl: https://www.zotero.org/styles/vancouver
format:
html:
toc: true
toc-depth: 3
code-fold: true
code-tools: true
number-sections: true
fig-width: 6
fig-height: 4
fig-align: center
knitr:
opts_chunk:
message: false
warning: false
fig.retina: 2
---
*Part 1 of a 5-part series on game theory for theoretical epidemiologists. The goal is not a comprehensive textbook but a working vocabulary, a few canonical examples, and a clear sense of where game-theoretic ideas plug into the compartmental models we already build.*
# From Nash to epidemics: a brief history
Game theory began as a mathematical theory of economic behavior, but its relevance to biology was recognized almost immediately. Von Neumann and Morgenstern laid the foundations for strategic interaction in 1944, and Nash's equilibrium concept followed in 1950. Maynard Smith and Price then transposed these ideas onto evolution, introducing the **evolutionarily stable strategy** (ESS) and making game theory a tool of population biology.
The bridge to infectious diseases came much later. Early epidemic models — Kermack–McKendrick SIR, the $R_0$ threshold, mass-action mixing — treated individuals as passive particles whose behavior was not part of the dynamics. That was a powerful simplification, but it left a class of problems unresolved. Why does measles vaccination coverage stall below the herd-immunity threshold in populations where vaccines are free, safe, and effective? Why did adherence to social-distancing guidance during COVID-19 decay over time, even as incidence rose?
Bauch and Earn [@bauch2004] gave the first crisp formulation of the puzzle. Vaccination is a **decision**, and decisions respond to incentives. When enough others are vaccinated, I am protected by herd immunity whether I vaccinate or not; if vaccination carries any perceived cost — side effects, time, ideological friction — then the individually rational calculation diverges from what is socially optimal. The mechanism that makes vaccines protective at the population level creates a free-rider problem at the individual level. No one needs to be irrational or misinformed. *It is an equilibrium property of a coordination problem with externalities* — a structural feature, not a character flaw.
# Game theory in epidemiology and infectious diseases
The literature that followed Bauch and Earn has branched in several directions, each relevant to the diseases we work on at IVI:
- **Coupled behavior–disease dynamics**. Individual decisions respond to current prevalence; prevalence responds to those decisions. Funk, Salathé and Jansen [@funk2010] give the canonical review of how behavioral feedback reshapes transmission. Reluga [@reluga2010] formulates social distancing as a *differential* game, where strategies evolve continuously during an outbreak.
- **Imitation and social learning on networks**. Rational best-response is a strong assumption. Bauch [@bauch2005] showed that when individuals imitate neighbors rather than maximize expected utility, the coupled system can produce stable *limit cycles* in vaccine uptake, matching the oscillations observed in the pertussis record from England and Wales. Fu, Rosenbloom, Wang and Nowak [@fu2011] extend imitation dynamics onto social networks and show that network structure can paradoxically lower equilibrium coverage below the well-mixed prediction.
- **Vaccine scares and memory effects**. Bauch and Bhattacharyya [@bauch2012] use evolutionary game theory with social learning to explain why coverage is slow to recover after a vaccine scare, even when the scare is retracted — a mechanism directly relevant to HPV, MMR, and more recently COVID-19 vaccines.
- **Pathogen evolution**. When strains compete for hosts, transmissibility and virulence coevolve according to an evolutionary game. The Anderson–May trade-off [@anderson1982] and its modern refinements [@alizon2009] remain the framework for predicting which strains are evolutionarily stable — relevant for typhoid Vi-conjugate vaccines, cholera O1/O139 dynamics, and SARS-CoV-2 antigenic evolution.
- **Unified reviews**. Wang and colleagues [@wang2016] provide an encyclopedic review (113 pages) of the statistical-physics perspective on vaccination games. Chang and colleagues [@chang2020] classify the literature by population structure (compartmental vs. network), game frequency (one-shot vs. iterated), and strategy-adoption rule (best-response vs. imitation). Verelst and colleagues [@verelst2016] give a focused systematic review of behavior-change models published between 2010 and 2015.
A recurring theme is that **ignoring behavior is no longer a safe default**. Compartmental models without a game-theoretic layer systematically mispredict epidemic curves when behavior is adaptive, as we all observed during 2020–2022.
::: {.callout-tip}
## What you need
```r
install.packages(c("dplyr", "tidyr", "ggplot2", "patchwork"))
```
Code tested with: R 4.4, `ggplot2 3.5`, `dplyr 1.1`.
:::
---
# The vaccination game
Consider a large, well-mixed population facing an imminent epidemic. Each individual $i$ chooses a probability $p_i \in [0, 1]$ of vaccinating before the outbreak. Let $\pi$ denote the population-average coverage. We posit:
| Quantity | Symbol | Meaning |
| --- | --- | --- |
| Vaccine cost (relative) | $r \in (0, 1)$ | Perceived cost of vaccination as a fraction of infection cost |
| Basic reproduction number | $R_0$ | Dimensionless |
| Critical coverage | $\pi_c = 1 - 1/R_0$ | Herd-immunity threshold |
| Infection probability (unvaccinated) | $\pi_{\text{inf}}(\pi)$ | Decreasing in $\pi$; zero above $\pi_c$ |
**Expected cost to individual $i$:**
$$
\mathcal{C}_i(p_i, \pi) \;=\; p_i \cdot r \;+\; (1 - p_i) \cdot \pi_{\text{inf}}(\pi).
$$
**Nash equilibrium.** A coverage $\pi^*$ is a Nash equilibrium if no individual can do strictly better by unilaterally deviating, given $\pi^*$. For an *interior* equilibrium $0 < \pi^* < \pi_c$, individuals must be indifferent:
$$
r \;=\; \pi_{\text{inf}}(\pi^*). \tag{1}
$$
**Social optimum.** A social planner chooses $\hat{\pi}$ to minimize total expected cost per capita:
$$
\hat{\pi} \;=\; \arg\min_{\pi} \big[\, \pi \cdot r + (1 - \pi) \cdot \pi_{\text{inf}}(\pi) \,\big]. \tag{2}
$$
Because each additional vaccination reduces $\pi_{\text{inf}}$ for *others* — an externality individuals do not internalize — we obtain the **fundamental inequality**:
$$
\pi^* \;\le\; \hat{\pi}. \tag{3}
$$
The gap $\hat\pi - \pi^*$ is the **price of anarchy** of the vaccination game, expressed in units (coverage) that our compartmental models already speak.
---
# Simulating the game in R
We implement the simplest tractable form: $\pi_{\text{inf}}(\pi) = q \cdot \max(0,\; 1 - \pi / \pi_c)$, where $q$ is the attack rate in a fully unvaccinated epidemic. This piecewise-linear form is not essential — any decreasing function will do — but keeps the algebra transparent.
```{r}
#| label: setup
library(dplyr)
library(tidyr)
library(ggplot2)
library(patchwork)

theme_set(
    theme_minimal(base_size = 10) +
        theme(
            panel.grid.minor   = element_blank(),
            plot.title         = element_text(face = "bold", size = 10),
            legend.position    = "bottom"
        )
)

C_NASH <- "#F44336" # red
C_SOCIAL <- "#2196F3" # blue
C_CRIT <- "#4CAF50" # green
C_GAP <- "#9C27B0" # purple (price of anarchy)
```
## Infection probability, Nash equilibrium, social optimum
```{r}
#| label: core-functions
# Infection probability for an unvaccinated individual at coverage pi
pi_inf <- function(pi, R0, q) {
    pi_c <- 1 - 1 / R0
    q * pmax(0, 1 - pi / pi_c)
}

# Nash equilibrium from indifference: pi_inf(pi*) = r
nash_coverage <- function(R0, q, r) {
    pi_c <- 1 - 1 / R0
    if (r >= q) {
        return(0)
    } # never vaccinate
    uniroot(\(pi) pi_inf(pi, R0, q) - r,
        interval = c(0, pi_c)
    )$root
}

# Social optimum: minimize expected per-capita cost
social_optimum <- function(R0, q, r) {
    optimize(\(pi) pi * r + (1 - pi) * pi_inf(pi, R0, q),
        interval = c(0, 1)
    )$minimum
}
```
## A single parameter set
Let us evaluate the game at $R_0 = 5$, $q = 0.5$, $r = 0.10$ — broadly representative of a measles-like pathogen with a moderate perceived vaccine cost.
```{r}
#| label: single-point
R0 <- 5
q <- 0.5
r <- 0.10
pi_c <- 1 - 1 / R0
pi_n <- nash_coverage(R0, q, r)
pi_s <- social_optimum(R0, q, r)

tibble(
    quantity = c(
        "Critical coverage (pi_c)",
        "Nash coverage (pi*)",
        "Social optimum (pi_hat)",
        "Price of anarchy (pi_hat - pi*)"
    ),
    value = c(pi_c, pi_n, pi_s, pi_s - pi_n)
) |>
    mutate(value = sprintf("%.3f", value)) |>
    knitr::kable()
```
At this parameter set the Nash equilibrium $\pi^* = 0.64$ sits a full 16 percentage points below $\pi_c = 0.80$. The social optimum reaches $\pi_c$ exactly — which is a general property whenever the planner's marginal cost of vaccination equals the marginal benefit of averted infection at the threshold.
---
# Results
## Sweep over $R_0$
How does the Nash equilibrium respond as we vary transmissibility? This is the most policy-relevant question: for highly transmissible pathogens (measles, pertussis), herd immunity is close to 1, and even a small behavioral gap can matter enormously.
```{r}
#| label: sweep-R0
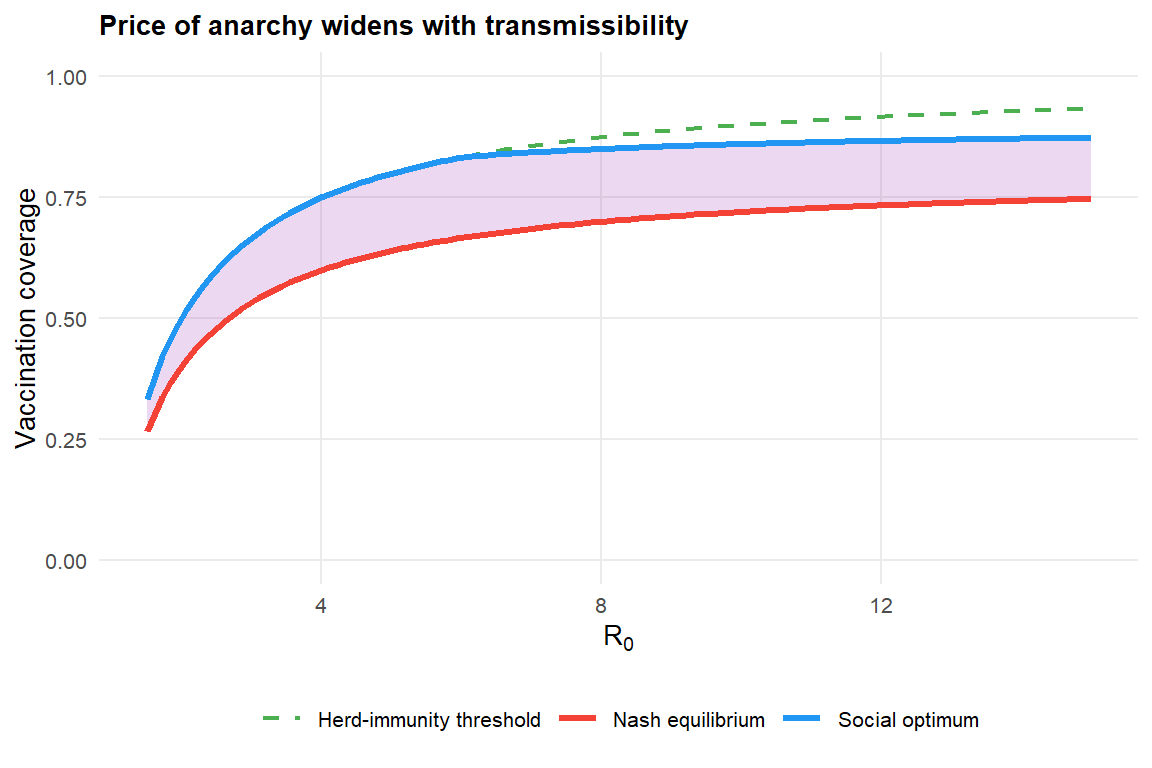
#| fig-cap: "Nash equilibrium, social optimum, and herd-immunity threshold as functions of $R_0$, with $q = 0.5$, $r = 0.10$. The shaded band shows the price of anarchy."
#| fig-width: 6
#| fig-height: 4
q <- 0.5
r <- 0.10
R0_grid <- seq(1.5, 15, length.out = 120)

sweep <- tibble(
    R0      = R0_grid,
    pi_c    = 1 - 1 / R0_grid,
    pi_nash = sapply(R0_grid, nash_coverage, q = q, r = r),
    pi_soc  = sapply(R0_grid, social_optimum, q = q, r = r)
)

ggplot(sweep, aes(x = R0)) +
    geom_ribbon(aes(ymin = pi_nash, ymax = pi_soc),
        fill = C_GAP, alpha = 0.18
    ) +
    geom_line(aes(y = pi_c, colour = "Herd-immunity threshold"), linewidth = 0.8, linetype = "dashed") +
    geom_line(aes(y = pi_soc, colour = "Social optimum"), linewidth = 1.1) +
    geom_line(aes(y = pi_nash, colour = "Nash equilibrium"), linewidth = 1.1) +
    scale_colour_manual(
        values = c(
            "Herd-immunity threshold" = C_CRIT,
            "Social optimum" = C_SOCIAL,
            "Nash equilibrium" = C_NASH
        ),
        name = NULL
    ) +
    labs(
        x = expression(R[0]),
        y = "Vaccination coverage",
        title = "Price of anarchy widens with transmissibility"
    ) +
    coord_cartesian(ylim = c(0, 1))
```
Two patterns emerge:
1. **The Nash curve saturates.** Individual incentive to vaccinate diminishes as others do the work, so $\pi^*$ grows more slowly than $\pi_c$. For highly transmissible pathogens, voluntary uptake alone will not reach herd immunity at any realistic vaccine cost.
2. **The price of anarchy is not monotone.** It is small for low-$R_0$ pathogens (where vaccination is unnecessary) and for very high-$R_0$ ones (where individuals vaccinate anyway because infection is nearly certain). It peaks at intermediate transmissibility — exactly the regime most common in practice.
## Sensitivity to perceived vaccine cost
The vaccine cost $r$ is the lever that behavior-change interventions pull on. Subsidies, information campaigns, and paid sick leave all reduce effective $r$; vaccine scares increase it.
```{r}
#| label: sweep-r
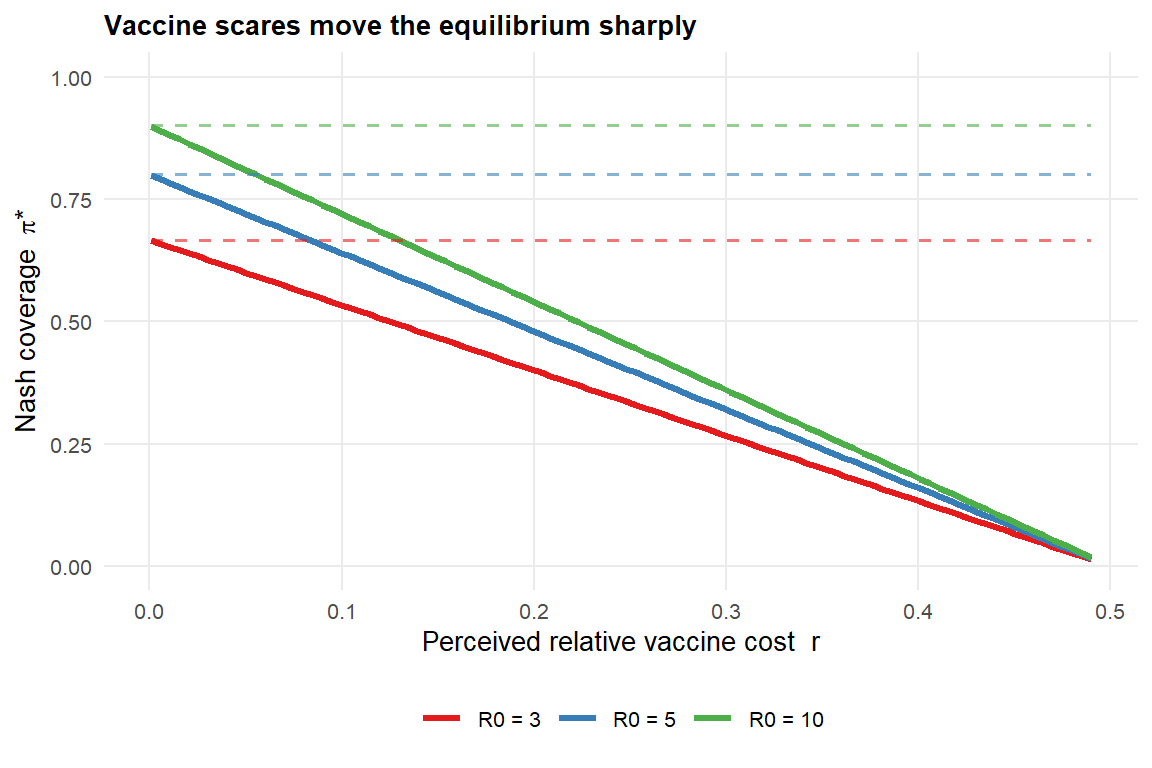
#| fig-cap: "Nash vaccination coverage as a function of perceived vaccine cost $r$, for three values of $R_0$. The dashed line is the herd-immunity threshold at each $R_0$."
#| fig-width: 6
#| fig-height: 4
q <- 0.5
grid <- expand_grid(
    R0 = c(3, 5, 10),
    r  = seq(0.001, 0.49, length.out = 100)
) |>
    rowwise() |>
    mutate(
        pi_nash = nash_coverage(R0, q, r),
        pi_c    = 1 - 1 / R0
    ) |>
    ungroup() |>
    mutate(R0 = factor(R0, labels = c("R0 = 3", "R0 = 5", "R0 = 10")))

ggplot(grid, aes(x = r, y = pi_nash, colour = R0)) +
    geom_line(linewidth = 1.1) +
    geom_line(aes(y = pi_c, colour = R0), linetype = "dashed", linewidth = 0.6, alpha = 0.6) +
    scale_colour_brewer(palette = "Set1", name = NULL) +
    labs(
        x = "Perceived relative vaccine cost  r",
        y = expression("Nash coverage  " * pi * "*"),
        title = "Vaccine scares move the equilibrium sharply"
    ) +
    coord_cartesian(ylim = c(0, 1))
```
Two observations Bauch and Earn [@bauch2004] flagged in the original paper, reproduced here:
- Equilibrium coverage is **highly sensitive** to $r$ near zero. A modest increase in perceived cost (a scare) can cause a large drop in uptake.
- Pathogens with higher $R_0$ are **more sensitive to $r$**, not less, because the herd-immunity threshold is higher and the free-rider temptation correspondingly stronger.
This is the mechanism behind the 1970s UK pertussis scare analyzed by Bauch [@bauch2005]: a small perceived-risk shock produced a large, slow-to-recover drop in coverage, followed by a resurgence of cases.
---
# What the vaccination game tells us
| Property | Answer |
| --- | --- |
| Does voluntary vaccination reach herd immunity? | Not in general — only when $r = 0$ or $R_0$ is low. |
| Is vaccine hesitancy evidence of irrationality? | No — individually rational free-riding suffices. |
| How big is the gap (price of anarchy)? | Largest at intermediate $R_0$; can be tens of percentage points. |
| Does reducing perceived cost help? | Yes, disproportionately so near $r \approx 0$. |
| Do vaccine scares cause lasting damage? | Yes — especially for high-$R_0$ pathogens. |
| Is the well-mixed assumption critical? | It matters — network structure can worsen the equilibrium [@fu2011]. |
---
# Extensions worth exploring
**Imperfect vaccines.** Real vaccines provide partial protection. When efficacy drops below 1, the Nash equilibrium can fall even further below $\pi_c$, and the herd-immunity threshold itself shifts.
**Heterogeneous populations.** Children, adults, and the elderly face different infection costs and transmission roles. The multi-group vaccination game ([9](#ref-wang2016)) yields group-specific $\pi^*$ values and is the natural framework for optimizing age-targeted schedules.
**Dynamic games.** When decisions are made during the epidemic rather than before, the game becomes a differential game [@reluga2010]. The timing of peak adherence and the window for vaccine development both become endogenous.
**Replicator dynamics.** If individuals imitate rather than best-respond, the Nash equilibrium is replaced by the rest points of the replicator equation [@bauch2005], and limit cycles become possible. Post 3 of this series develops this in depth.
**Applications to diseases I work on.** For cholera, the reactive-vs-pre-emptive OCV allocation problem is a coordination game with incomplete information across countries and agencies. For typhoid, Vi-TCV introduction interacts with the evolutionary game between Vi-positive and Vi-negative *Salmonella Typhi* strains. Both are treated in Post 4 and Post 5.
---
# The series roadmap
1. **(This post) Foundations.** Vaccination game, Nash equilibrium, social optimum, price of anarchy.
2. **The vaccination game in depth.** Imperfect vaccines, heterogeneity, multi-strain games, calibration to coverage data.
3. **Coupled behavior–disease dynamics.** Replicator and imitation dynamics layered onto SIR models.
4. **Evolutionary game theory for pathogens.** Virulence–transmissibility trade-offs, ESS analysis, strain replacement under vaccination pressure — with cholera and typhoid as running examples.
5. **Policy and mechanism design.** Subsidies, mandates, information campaigns, network games, and agentic LLM-driven decision models.
---
# References {.unnumbered}
::: {#refs}
:::
```{r}
#| label: session-info
#| echo: false
cat(sprintf("R %s\n", paste(R.version$major, R.version$minor, sep = ".")))
for (pkg in c("ggplot2", "dplyr", "tidyr", "patchwork")) {
cat(sprintf("%-10s %s\n", pkg, as.character(packageVersion(pkg))))
}
```