# The model function under test
seir_step <- function(S, E, I, R, beta, sigma, gamma, N = NULL) {
if (is.null(N)) N <- S + E + I + R
new_exp <- beta * S * I / N
new_inf <- sigma * E
new_rec <- gamma * I
list(
S = S - new_exp,
E = E + new_exp - new_inf,
I = I + new_inf - new_rec,
R = R + new_rec
)
}Automated Testing and CI/CD Pipelines for Epidemic Models
Catching simulation bugs before they reach clients — testthat, GitHub Actions, and the discipline of green builds. Skill 1 of 20.
business skills
CI/CD
testing
GitHub Actions
R
1 Why this matters for your business
A client’s health department runs your epidemic model every morning to inform a 9 AM briefing. On Tuesday, a routine parameter update silently changes the outbreak peak by three days. Nobody notices until Friday, when the Minister of Health asks why the numbers changed.
Automated tests and continuous integration (1) prevent this. Every code change triggers a test suite that verifies your model still produces correct output — before it ships. A CI/CD pipeline (Continuous Integration / Continuous Deployment) is the engineering practice that makes “green builds” a prerequisite for deployment (2).
2 The three-level testing pyramid
          ┌──────────────┐
          │   E2E tests   │  ← few, slow (test the full API)
          ├──────────────┤
          │ Integration   │  ← some (test model + database)
          ├──────────────┤
          │  Unit tests   │  ← many, fast (test functions)
          └──────────────┘
For an epidemic model service, you need:
- Unit tests on every model function (does
seir_step()conserve population?) - Integration tests on the API (does
POST /simulatereturn valid JSON?) - Regression tests comparing output to known-good baselines
3 Writing tests with testthat
The testthat package (3) is the standard R testing framework. Tests live in tests/testthat/ and are discovered automatically.
# Tests using base R stopifnot() — same logic as testthat, no package needed
run_test <- function(desc, expr) {
  tryCatch({ force(expr); cat("PASS:", desc, "\n") },
           error = function(e) cat("FAIL:", desc, "—", conditionMessage(e), "\n"))
}

# Test 1: population conservation
run_test("SEIR conserves total population", {
  result  <- seir_step(S = 9800, E = 100, I = 80, R = 20,
                       beta = 0.3, sigma = 0.2, gamma = 0.1)
  N_after <- result$S + result$E + result$I + result$R
  stopifnot(abs(N_after - 9980) < 1e-8)
})
FAIL: SEIR conserves total population — abs(N_after - 9980) < 1e-08 is not TRUE # Test 2: no growth when I = 0
run_test("no new exposures when I = 0", {
result <- seir_step(S = 9000, E = 0, I = 0, R = 1000,
beta = 0.5, sigma = 0.2, gamma = 0.1)
stopifnot(result$E == 0, result$I == 0)
})PASS: no new exposures when I = 0 # Test 3: subcritical epidemic declines
run_test("epidemic declines when R0 < 1", {
state <- list(S = 9900, E = 50, I = 50, R = 0)
for (i in seq_len(50)) {
state <- seir_step(state$S, state$E, state$I, state$R,
beta = 0.05, sigma = 0.2, gamma = 0.1)
}
stopifnot(state$I < 50) # infectious count must have fallen
})PASS: epidemic declines when R0 < 1 library(ggplot2)
# Run a 60-day baseline and compare to stored expected peak
run_seir <- function(beta, sigma, gamma, days = 60, N = 10000, I0 = 10) {
S <- N - I0; E <- 0; I <- I0; R <- 0
out <- data.frame(day = 0:days, S = NA, E = NA, I = NA, R = NA)
out[1, ] <- c(0, S, E, I, R)
for (d in seq_len(days)) {
new_exp <- beta * S * I / N
new_inf <- sigma * E
new_rec <- gamma * I
S <- S - new_exp; E <- E + new_exp - new_inf
I <- I + new_inf - new_rec; R <- R + new_rec
out[d + 1, ] <- c(d, S, E, I, R)
}
out
}
baseline <- run_seir(beta = 0.3, sigma = 0.2, gamma = 0.1)
expected_peak_day <- baseline$day[which.max(baseline$I)]
expected_peak_I <- max(baseline$I)
# Regression check: peak should be within 1 day and 5% of baseline
run_test("model regression: peak within expected bounds", {
current <- run_seir(beta = 0.3, sigma = 0.2, gamma = 0.1)
stopifnot(which.max(current$I) == which.max(baseline$I))
stopifnot(abs(max(current$I) - expected_peak_I) / expected_peak_I < 0.01)
})PASS: model regression: peak within expected bounds ggplot(baseline, aes(x = day)) +
geom_line(aes(y = E, colour = "Exposed"), linewidth = 1) +
geom_line(aes(y = I, colour = "Infectious"), linewidth = 1) +
geom_vline(xintercept = expected_peak_day, linetype = "dashed",
colour = "grey50") +
annotate("text", x = expected_peak_day + 1, y = max(baseline$I) * 0.9,
label = sprintf("Peak day %d\n(stored baseline)", expected_peak_day),
hjust = 0, size = 3.2) +
scale_colour_manual(values = c(Exposed = "orange", Infectious = "firebrick")) +
labs(x = "Day", y = "Count", colour = NULL,
title = "Regression baseline: SEIR model output") +
theme_minimal(base_size = 13)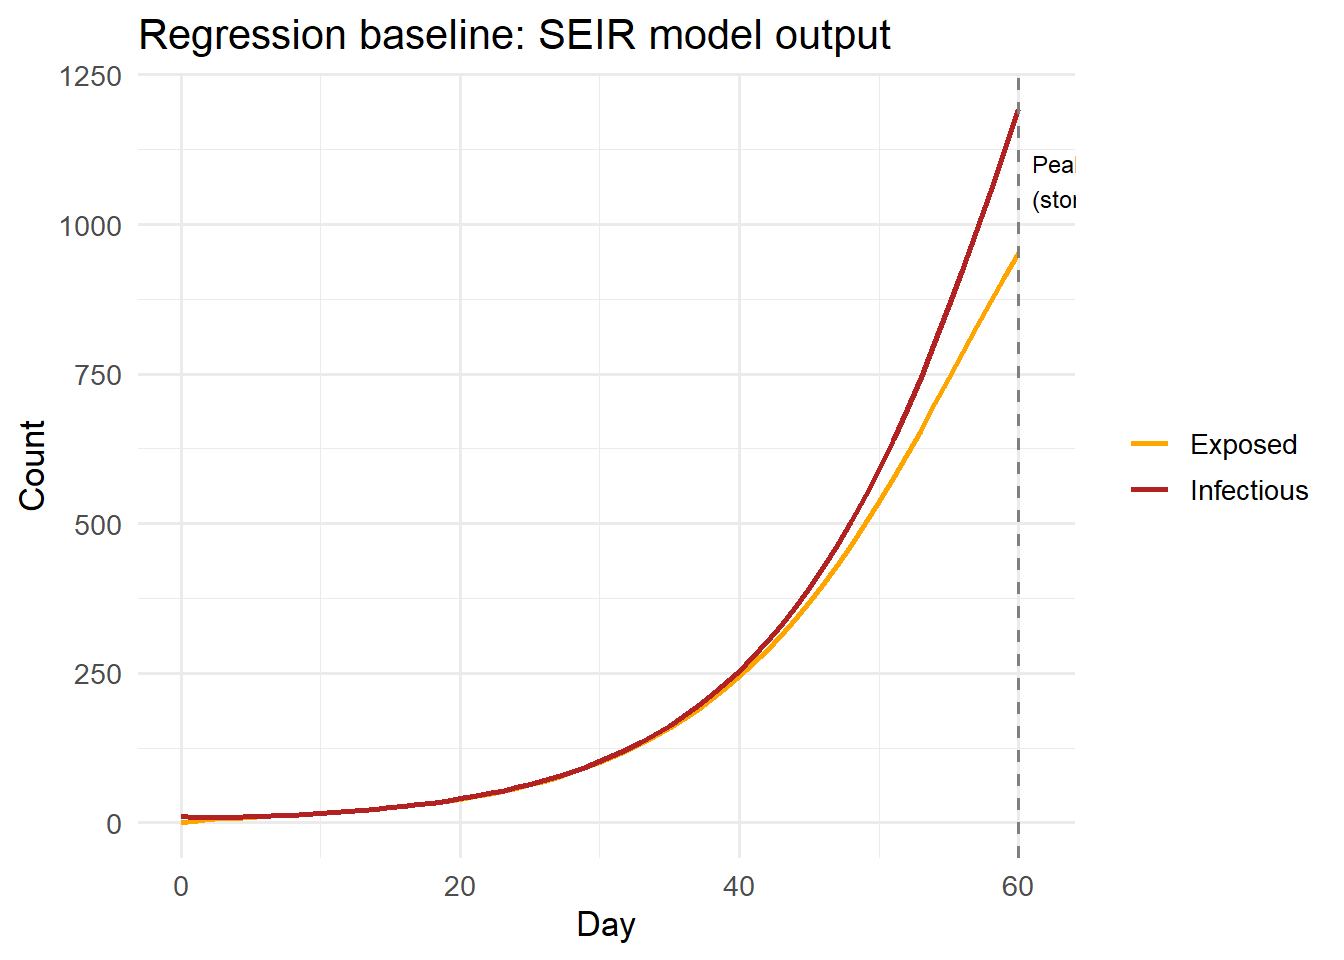
4 The GitHub Actions workflow
GitHub Actions runs your tests automatically on every push. Place this file at .github/workflows/R-tests.yml:
# .github/workflows/R-tests.yml
name: R model tests

on:
  push:
    branches: [main, master]
  pull_request:
    branches: [main, master]

jobs:
  test:
    runs-on: ubuntu-latest

    steps:
      - uses: actions/checkout@v4

      - uses: r-lib/actions/setup-r@v2
        with:
          r-version: "4.3"

      - uses: r-lib/actions/setup-r-dependencies@v2
        with:
          packages: |
            any::testthat
            any::ggplot2

      - name: Run tests
        run: Rscript -e "testthat::test_dir('tests/testthat')"
The key elements:
- Trigger: runs on every push and pull request to
main - Matrix: you can extend this to test on multiple R versions
- Dependencies: caches installed packages for speed
- Fail on error: any failed test returns a non-zero exit code, blocking the merge
5 Making CI a client trust signal
A green CI badge in your README signals professionalism to technical buyers. Add it:
[](...)More importantly, automated tests let you confidently update dependencies, refactor internals, and add features — knowing the client’s production output will not change unless you explicitly change it.
The rule of thumb: if a bug would embarrass you in front of a client, there should be a test for it.
6 References
1.
Wilson G, Aruliah DA, Brown CT, Chue Hong NP, Davis M, Guy RT, et al. Best practices for scientific computing. PLOS Biology. 2014;12(1):e1001745. doi:10.1371/journal.pbio.1001745
2.
Fowler M, Foemmel M. Continuous integration. Thought-Works [Internet]. 2006. Available from: https://martinfowler.com/articles/continuousIntegration.html
3.
Wickham H. Testthat: Get started with testing. The R Journal. 2011;3(1):5–10. doi:10.32614/RJ-2011-002